Tableau Training in Hyderabad
With
Certification & Placement Support
Students Successfully Trained
Professional Batches Completed
Students Placed in IT Companies
Tableau Course in Hyderabad
Next Batch Details
| Batch Information | Details |
|---|---|
| Trainer Name | Mr. Rahul Sharma |
| Trainer Experience | 12+ Years in Data Visualization & Tableau |
| Next Batch Date | 23 March 2026 |
| Training Modes | Online & Offline Training (Instructor-Led) |
| Course Duration | 6–8 Weeks (Weekend & Weekday Batches Available) |
| Call Us At | +91 86868 36999 |
| Email Us At | info@excelytics.com |
| Demo Class Details | ENROLL FOR FREE DEMO CLASS |
Why excelytics is the Best Tableau Training Institute in Hyderabad

Industry-Oriented Tableau Curriculum
Learn the complete Tableau workflow including data connection, data preparation, visualization, and dashboard creation used in real-world business environments.

Master Tableau & Data Visualization Tools
Get hands-on training in Tableau Desktop, Tableau Public, and data visualisation techniques used by modern businesses.

Real-Time Tableau Projects
Work on industry-level datasets and real business dashboards to gain practical experience in solving data visualization problems.

Dashboard & Data Visualization Training
Learn how to create interactive dashboards, charts, and reports in Tableau to present business insights effectively.
Data Analysis using Tableau & Excel
Develop strong skills in data analysis, data blending, and visualization using Tableau along with Excel integration.

Business Insights & Data Storytelling
Understand how organizations use Tableau dashboards to improve business decisions, marketing strategies, and performance analysis.

Portfolio-Based Learning
Build a professional Tableau project portfolio with real dashboards to showcase your skills during interviews.

Career-Focused Tableau Training
This course prepares you for roles like Tableau Developer, Data Analyst, BI Analyst, and Reporting Analyst with practical experience.
Why Choose Excelytics Academy for Tableau Training Institute in Hyderabad?
- Comprehensive Tableau curriculum designed for current industry needs
- Expert trainers with real-time experience in Tableau and data visualization tools
- Live instructor-led Tableau training with access to recorded sessions
- Hands-on training in Tableau Desktop, data visualization, and dashboard creation
- Practical data visualization exercises and real business reporting tasks
- Flexible learning options – classroom training, online training, and hybrid batches
- Industry-level Tableau dashboard projects using real-world datasets
- Dedicated career support including resume building and interview preparation
- LinkedIn profile optimization and mock interview practice sessions
- 100% Placement assistance with job referrals and career guidance
Tableau classes in Hyderabad
Tableau Course Curriculum
Introduction to Tableau
What is Data Analytics
Types of Data Analytics (Descriptive, Diagnostic, Predictive, Prescriptive)
Role of Data Analysts in Business
Understanding Data & Business Problems
Data Analytics Workflow
Data Connection & Data Preparation
- Connecting to Excel, CSV, SQL Databases
- Data Types & Data Roles
- Data Cleaning Techniques
- Data Blending vs Data Joining
- Working with Extracts & Live Connections
Tableau Interface & Basics
- Tableau Workspace Overview
- Dimensions vs Measures
- Shelves, Marks Card, Filters
- Creating Basic Charts
Data Visualization Techniques
- Bar Chart, Line Chart, Pie Chart
- Area Charts & Scatter Plots
- Maps & Geographic Data Visualization
- Heatmaps & Highlight Tables
Calculations in Tableau
- Creating Calculated Fields
- Logical Calculations (IF, CASE)
- Aggregate Functions (SUM, AVG, COUNT)
- Table Calculations
- Level of Detail (LOD) Expressions
Filters & Parameters
- Applying Filters (Basic & Advanced)
- Using Parameters in Dashboards
- Dynamic Filtering Techniques
Dashboard Creation
- Creating Interactive Dashboards
- Dashboard Layout & Design
- Actions (Filter, Highlight, URL Actions)
- Combining Multiple Visualizations
Advanced Tableau Concepts
- Data Blending & Data Joins
- Performance Optimization
- Advanced Calculations
- Custom Visualizations
Real-Time Tableau Projects
- Sales Dashboard Project
- Marketing Performance Dashboard
- Customer Analysis Dashboard
- Business KPI Dashboard
Tableau Server & Publishing
- Publishing Dashboards to Tableau Public / Server
- Sharing Reports & Dashboards
- Tableau Online Basics
Capstone Project
- End-to-End Tableau Project
- Data Cleaning → Visualization → Dashboard
- Business Insights Presentation
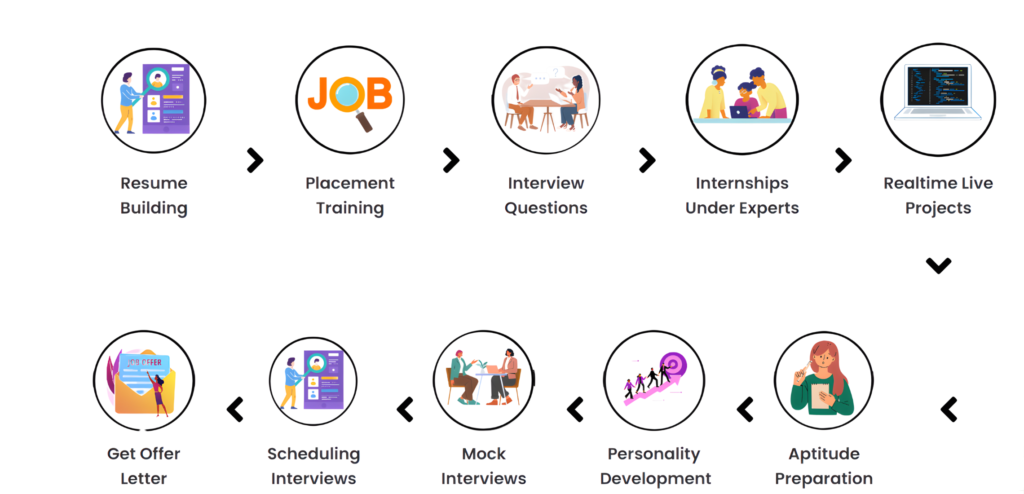
Career Support & Interview Preparation
Resume Building for Tableau Roles
Portfolio Development
Interview Questions & Mock Interviews
Job Assistance & Placement Support
What is Tableau?
Tableau is a leading data visualization tool used to transform raw data into interactive and easy-to-understand dashboards. It helps businesses analyze large datasets and present insights through charts, graphs, and reports. In today’s data-driven world, organizations rely on Tableau to track performance, identify trends, and make better decisions.
In simple terms, Tableau converts complex data into visual stories that help businesses understand information quickly and take action effectively.
- Data Collection
- Data Preparation
- Data Blending & Transformation
- Data Visualization
- Dashboard Creation
- Business Insights & Decision Making
Where is Tableau Used?
Tableau is widely used across various industries to visualize data, create interactive dashboards, and generate business insights. Organizations use Tableau to simplify complex data and make faster, data-driven decisions.
| Industry | How Tableau is Used |
|---|---|
| Marketing & Digital Marketing | Creating campaign dashboards, analyzing customer behavior, and tracking website performance. |
| Banking & Finance | Visualizing financial data, risk analysis dashboards, and fraud detection reporting. |
| Healthcare | Patient data visualization, hospital performance dashboards, and healthcare analytics reporting. |
| Retail & E-Commerce | Sales dashboards, customer insights, product performance tracking, and inventory visualization. |
| Manufacturing | Production dashboards, quality monitoring, and supply chain visualization. |
| Education | Student performance dashboards, academic analytics, and reporting systems. |
| Logistics & Supply Chain | Delivery tracking dashboards, route optimization, and inventory visualization. |
| Telecommunications | Network performance dashboards, customer usage insights, and churn analysis reports. |
| Entertainment & Media | Audience analytics dashboards, content performance tracking, and streaming insights. |
| Government & Public Sector | Data visualization for public reports, traffic analysis, and smart city dashboards. |
Benefits of the Tableau Training Course In Hyderabad
Benefits of the Course
High Demand Career Opportunities
Tableau professionals are in high demand across industries like IT, finance, healthcare, retail, and business intelligence.
Learn In-Demand Tableau Tools
Gain hands-on experience in Tableau Desktop, dashboard creation, and data visualisation techniques used in real companies.
Real-Time Project Experience
Work on practical datasets and real-time Tableau dashboards to understand how businesses visualize and analyze data.
Strong Data Visualization Skills
Learn how to create interactive dashboards, charts, and visual reports to present insights clearly.
Improved Analytical & Problem-Solving Skills
Develop the ability to analyse data visually and generate meaningful business insights.
Better Career Growth Opportunities
Tableau skills open doors to roles like Tableau Developer, Data Analyst, BI Analyst, and Reporting Analyst.
Best Tableau Training Institute in Hyderabad
Meet Our Tableau Trainers
Skills You’ll Gain from Tableau Training
Skills Developed after the course
- Data Preparation & Cleaning in Tableau
- Tableau Data Visualization Techniques
- Interactive Dashboard Creation
- Advanced Tableau Calculations & Functions
- Data Connection & Blending in Tableau
- Business Intelligence with Tableau
- Analytical Thinking using Visual Data
- Problem-Solving through Dashboards
- Data Interpretation & Reporting with Tableau
- Data Storytelling using Visualizations
- Real-Time Tableau Project Experience
- Decision-Making with Tableau Insights
What Tools covered in the Tableau Course in Hyderabad


Tableau Training In Hyderabad With Placement Program
Prerequisites & Eligibility for Tableau Training Course In Hyderabad
- Basic Computer Knowledge
Understanding of computers and basic software usage is sufficient to get started.
- No Coding Background Required
Tableau is a user-friendly tool, so no programming knowledge is required for beginners.
- Basic Understanding of Data Concepts
Familiarity with data, charts, and simple analysis concepts will be helpful.
- Interest in Data Visualization
Curiosity to create dashboards and visual reports is important for learning Tableau.
- Graduates from Any Stream
Students from B.Tech, B.Sc, B.Com, BBA, MBA, or any background can enroll.
- Working Professionals & Freshers Eligible
Suitable for both freshers and professionals who want to build skills in data visualization and business intelligence.
Tableau Salary in Hyderabad – Freshers to Experienced
Tableau professionals in Hyderabad can expect salaries starting from ₹3–5 LPA for freshers and going up to ₹15+ LPA for experienced professionals, depending on skills, experience, and expertise in Tableau and data visualization.
| Experience Level | Job Role | Average Salary (Per Year) |
|---|---|---|
| 0 – 1 Year (Fresher) | Tableau Developer / Junior Data Analyst | ₹3,00,000 – ₹5,00,000 |
| 1 – 3 Years | Tableau Developer / Data Analyst | ₹4,00,000 – ₹8,00,000 |
| 3 – 5 Years | Senior Tableau Developer | ₹6,00,000 – ₹12,00,000 |
| 5 – 8 Years | Lead Tableau Developer | ₹10,00,000 – ₹18,00,000 |
| 8+ Years | BI Manager / Analytics Manager | ₹15,00,000 – ₹25,00,000+ |
Hiring Companies for Tableau Professionals in Hyderabad


Tableau certification training institutes in Hyderabad
FAQ'S
Why choose Excelytics for Tableau Training in Hyderabad?
Excelytics offers industry-focused Tableau training, real-time projects, expert trainers, and strong placement support to help you become job-ready.
Who can join the Tableau course?
Anyone can join, including students, graduates, freshers, and working professionals from any background.
Do I need coding knowledge to learn Tableau?
No, Tableau is a no-code data visualization tool, and beginners can easily learn it without programming knowledge.
What will I learn in the Tableau course?
You will learn data visualization, dashboard creation, calculated fields, filters, and real-time projects using Tableau.
What is the duration of the Tableau course?
The course duration is typically 4 to 8 weeks, depending on the batch and learning mode.
Will I get a certificate after completing the course?
Yes, you will receive a Tableau course completion certificate after successfully finishing the training.
What job roles can I apply for after this course?
You can apply for roles like Tableau Developer, Data Analyst, BI Analyst, and Reporting Analyst.
What is the salary of a Tableau Developer in Hyderabad?
Freshers can earn around ₹3–5 LPA, and experienced professionals can earn ₹10+ LPA depending on skills and experience.